
At some time or another, we need to track down performance issues. It’s inevitable if you develop software for long enough, and especially in mobile development where there’s such a vast range of devices that need to be supported.
A tool I picked up and have adapted to suit my requirements, is Chris Pietschmann’s performance logging class.
What I love about this is just how quick and easy it is to track the performance of any block of code, like so:
private static void WorkHorse01()
{
    using (new DebugPerformanceTimerLogger())
    {
        Thread.Sleep(500);
    }
}
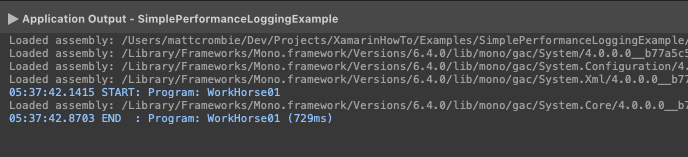
Once you’ve wrapped the code you want the execution time on just run things up and see the output in your debug output:
If you’re dealing with something more complex, you can modify the message that’s output to the console to include more information:
private static void WorkHorse03(int howMuchWork = 1)
{
    using (new DebugPerformanceTimerLogger($"Horse 3 gets a special description with the multiplier of 100 x {howMuchWork}"))
    {
        Thread.Sleep(100 * howMuchWork);
    }
}
Output:

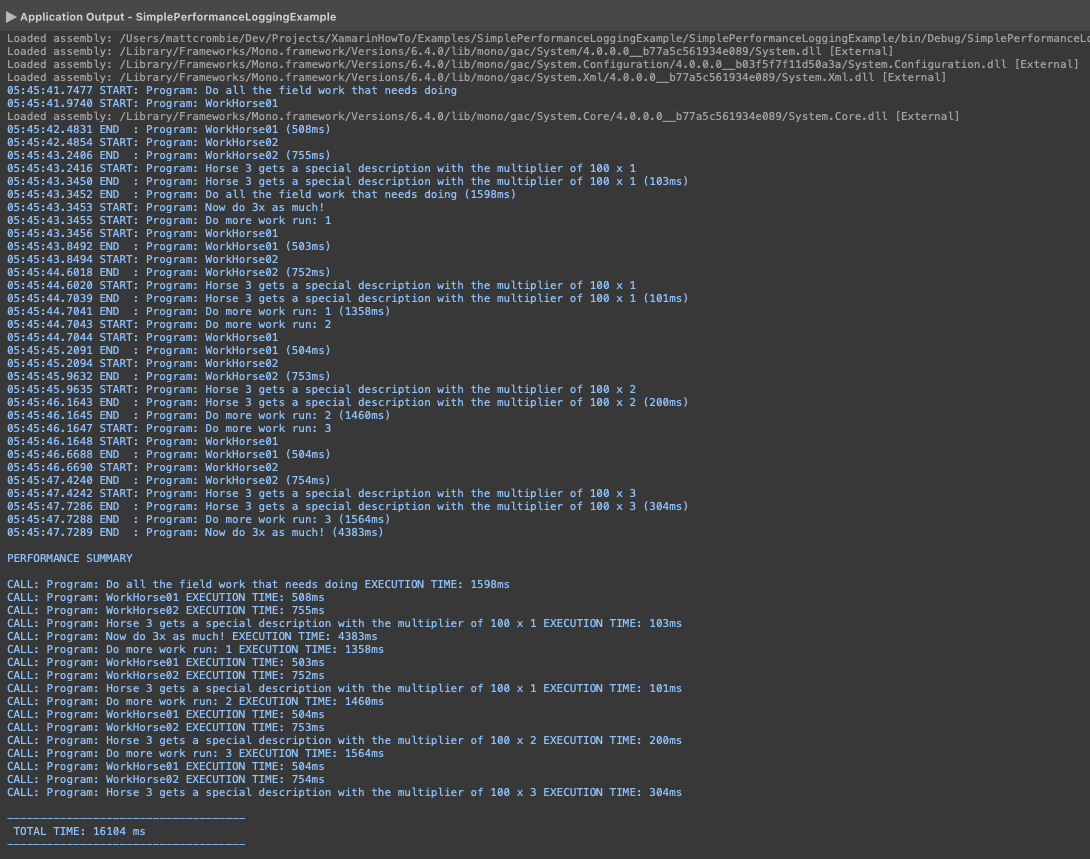
And finally, if you’ve got several processes being called from various places, you can get a nice summarised output of everything that’s been running and how long things took:
public static void Main(string[] args)
{
    using (new DebugPerformanceTimerLogger("Do all the field work that needs doing"))
    {
        WorkHorse01();
        WorkHorse02();
        WorkHorse03();
    }

    using (new DebugPerformanceTimerLogger("Now do 3x as much!"))
    {
        for (var i = 1; i <= 3; i++)
        {
            using (new DebugPerformanceTimerLogger($"Do more work run: {i}"))
            {
                WorkHorse01();
                WorkHorse02();
                WorkHorse03(i);
            }
        }
    }

    DebugPerformanceTimerLogger.GetSummary();
}

private static void WorkHorse01()
{
    using (new DebugPerformanceTimerLogger())
    {
        Thread.Sleep(500);
    }
}

private static void WorkHorse02()
{
    using (new DebugPerformanceTimerLogger())
    {
        Thread.Sleep(750);
    }
}

private static void WorkHorse03(int howMuchWork = 1)
{
    using (new DebugPerformanceTimerLogger($"Horse 3 gets a special description with the multiplier of 100 x {howMuchWork}"))
    {
        Thread.Sleep(100 * howMuchWork);
    }
}
Output:
Full component source code here:
using System;
using System.Collections.Generic;
using System.Diagnostics;
using System.IO;
using System.Linq;
using System.Runtime.CompilerServices;

namespace DarkIce.Toolkit.Core.Utilities
{
    public class DebugPerformanceTimerLogger : IDisposable
    {
        private readonly string _message;
        private readonly Stopwatch _timer;
        private static List<MutableKeyValuePair<string, long>> _log = new List<MutableKeyValuePair<string, long>>();

        public DebugPerformanceTimerLogger([CallerMemberName] string message = null, [CallerFilePath] string sourceFile = null)
        {
#if DEBUG
            try
            {
                var fileName = Path.GetFileNameWithoutExtension(sourceFile.Replace("\\", "/"));
                _message = $"{fileName}: {message}".Trim();
                _timer = new Stopwatch();
                _timer.Start();
                Debug.WriteLine($"{DateTime.Now:hh:mm:ss.ffff} START: {_message}");
                _log.Add(new MutableKeyValuePair<string, long>(_message, 0));
            }
            catch (Exception ex)
            {
                Debug.WriteLine(ex.ToString());
            }
#endif
        }

        public void Dispose()
        {
#if DEBUG
            try
            {
                _timer.Stop();
                var ms = _timer.ElapsedMilliseconds;
                Debug.WriteLine($"{DateTime.Now:hh:mm:ss.ffff} END  : {_message} ({ms}ms)");
                _log.LastOrDefault(x => x.Key == _message).Value = ms;
            }
            catch (Exception ex)
            {
                Debug.WriteLine(ex.ToString());
            }
#endif
        }

        [Conditional("DEBUG")]
        public static void GetSummary()
        {
            Debug.WriteLine("");
            Debug.WriteLine("PERFORMANCE SUMMARY");
            Debug.WriteLine("");

            foreach (var entry in _log)
            {
                Debug.WriteLine($"CALL: {entry.Key} EXECUTION TIME: {entry.Value} ms");
            }

            Debug.WriteLine("");
            Debug.WriteLine("------------------------------------");
            Debug.WriteLine($" TOTAL TIME: {_log.Sum(x => x.Value)} ms");
            Debug.WriteLine("------------------------------------");

            _log.Clear();
        }

        private class MutableKeyValuePair<KeyType, ValueType>
        {
            public KeyType Key { get; set; }
            public ValueType Value { get; set; }

            public MutableKeyValuePair() { }

            public MutableKeyValuePair(KeyType key, ValueType val)
            {
                Key = key;
                Value = val;
            }
        }
    }
}
So while just a simple thing, it can really help when you’re trying to get performance enhancements done in your apps.
If you want the entire working example, please have a look here on GitHub.


Nice post!
You could add [Conditional(“DEBUG”)] to your methods instead of using preprocessor directives, you will avoid a call to an empty method.
Good call out, thanks! Hadn’t thought of that, although only on the GetSummary() will it have an effect because on the .ctor() and Dispose() can’t function with that attribute and require the compiler flags. I’ll update things that I can here and going forward accordingly.